Calculating OEE at a Glance
OEE calculation is a staple KPI within the manufacturing industry. To track productivity in its rawest form, you must be able to calculate OEE accurately. OEE can be calculated by using the ratio of fully productive manufacturing time to planned production time. In other words, manufacturing high-quality products without unplanned downtime.
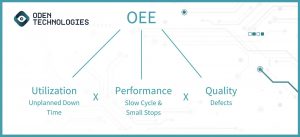
OEE is calculated by multiplying three key metrics together: Utilization, Performance and Quality. We’ll dive into each of the components but at a high level here is how each of the three components is calculated:
- Utilization is defined by availability loss which equals your actual run time divided by your planned production time.
- Performance is defined by performance loss which equals your total production count divided by run time. This metric is then divided by your ideal run rate.
- Quality is defined by the quality loss which equals the number of products that meet quality standards divided by the total number of products produced.
OEE Formula Breakdown
The formula for calculating OEE is Utilization (unplanned downtime) x Performance (slow cycles and small stops) x Quality (defects). Below is an in-depth breakdown of each component.
Calculating Utilization for OEE
Utilization takes into consideration all lengthily timed events that cause a stop in normal production. For example, a machine jam that causes production to halt for several minutes, or in extreme cases, several hours. Utilization is calculated by dividing run time by planned production time or Utilization = Run Time / Planned Production Time.
Run time is calculated by subtracting stop time from the planned production time. For example, in an 8 hour day, you have 480 minutes of planned production time. If you had 80 minutes of unplanned downtime your run time would equal 400 minutes; 480 minutes of planned production time minus 80 minutes of stoppage time. Therefore, utilization would be 400 minutes of run time divided by 480 minutes of planned production time which equals 0.8333 or 83.33% utilization.
In other words: (400 minutes Run Time) / (480 minutes Planned Production Time) = 83.33% utilization.
Calculating Performance for OEE
Performance is defined by incidents that cause the manufacturing process to run at anything but the maximum speed. This includes slower than normal cycles and smaller stops. Performance is calculated by dividing your Total Count by Run Time and comparing it to your Ideal Run Rate or Performance = (Total Count / Run Time) / Ideal Run Rate.
For example, if you produced 30,000 pieces (total count) in 400 minutes of run time and your ideal run rate is 80 parts per minute your performance would be calculated by dividing 30,000 count by 400 minutes and then dividing that number 80 parts per minute which equals 0.9375 or 93.75% performance.
In other words: (30,000 Count / 400 min Run Time) / 80 Parts Per Minute = 93.75% performance.
*It is important to note that performance should never be more than 100%. If performance is above this threshold, it can indicate that your Ideal Run Rate is set too low.
Calculating Quality for OEE
Quality takes into consideration defective products or any manufactured parts that do not conform to set quality standards. For the calculation, good count only equals the number of pieces that meet quality standards and is then divided by the total count of product produced or Quality = Good Count / Total Count.
For example, if you produced 20,000 pieces but only 18,858 conformed to quality standards your quality calculation would be 18,858 good count divided by 20,000 total counts which equals 0.9429 or 94.29% quality.
In other words: 18,858 Good Count / 20,000 Total Count = 94.29% quality.
Final OEE Calculation
The final step of OEE calculation is multiplying utilization, performance and quality together. Given the example above the final OEE would be 0.8333 utilization multiplied by 0.9375 performance multiplied by 0.9429 quality which equals 0.7366 or 73.66% OEE.
In other words: 0.8333 Utilization x 0.9375 Performance x 0.9429 Quality = 73.66% OEE.
What is a Good OEE Calculation?
An OEE calculation is only as good and accurate as the data that you are using. If you have inaccurate data, such as a lack of visibility into unplanned downtime versus scheduled stop time or unreliable quality data, your OEE calculation could be incorrect. Therefore, it is imperative to have the proper data for run times and inline quality to get a complete picture of your overall effectiveness and OEE.
Quality is often the most difficult metric to obtain when it comes to OEE. To continuously track inline quality is difficult and expensive. As a result, most quality measurements are taken offline; however, there is no standard approach to measuring offline quality. If you are measuring quality by weight, for example, there can be a lot of variability. The proper way to report defective products would be to measure only the defective product. However, some factory personnel might use bins to measure defective products which inflate scrap numbers because the bin itself is not actually scrap product. These inaccuracies are augmented when some operators measure quality by measuring in a bin and some operators measure quality by taking the products out of the bin.
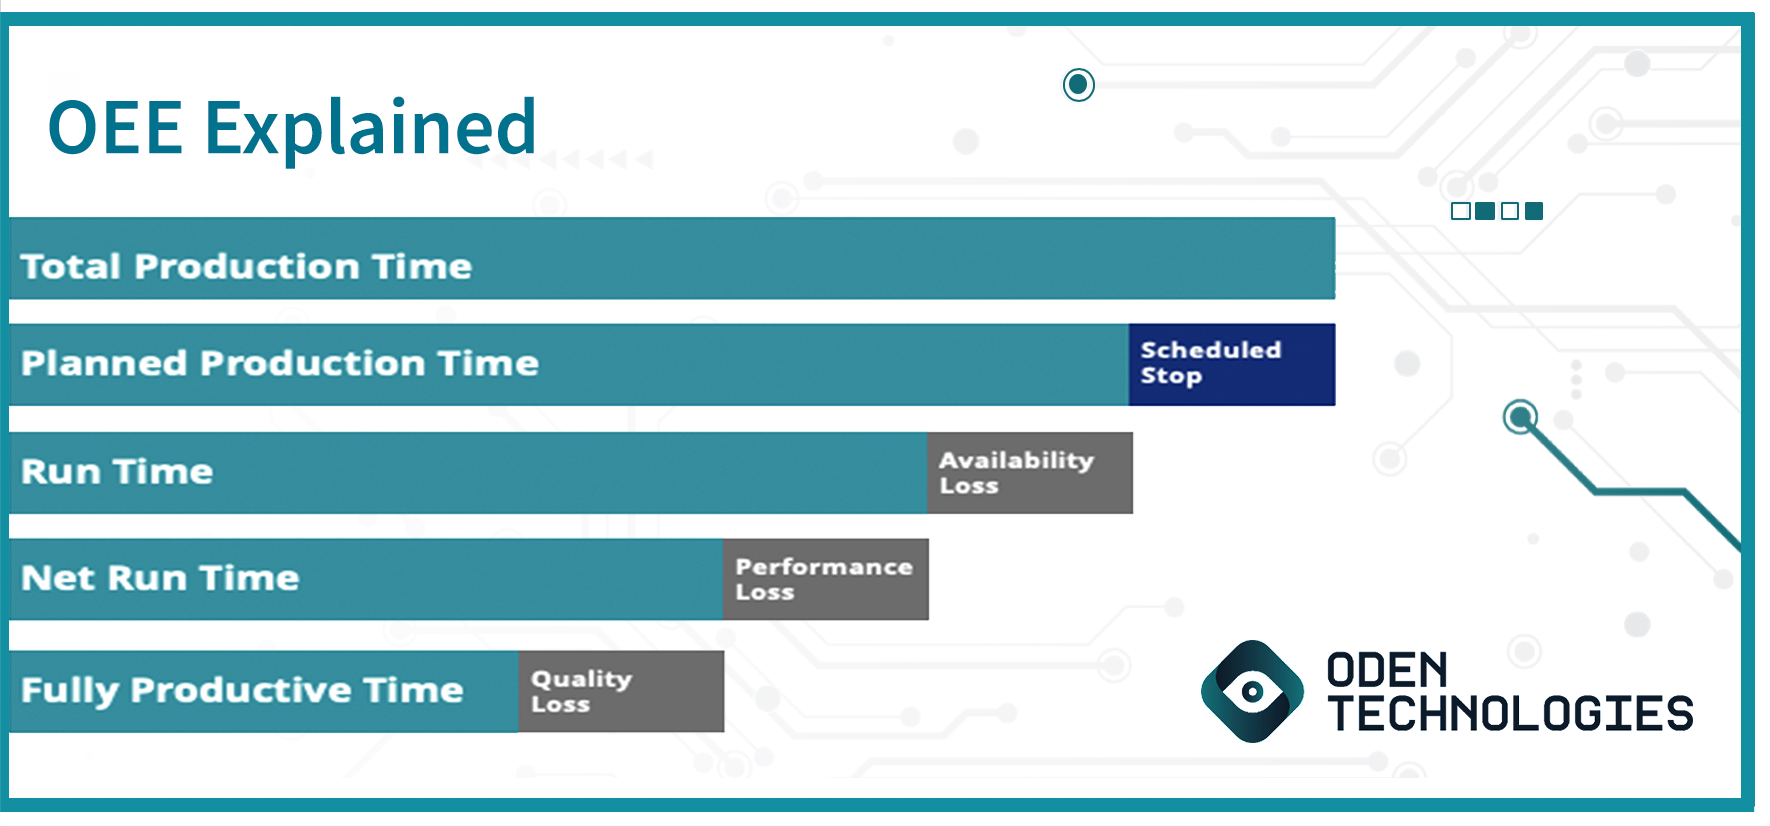
Finally, a good OEE calculation also follows the correct structure. For example, you must calculate the total production time, an 8-hour shift for example, and then subtract the scheduled stop time. From there you must remove availability loss, or your unplanned downtime; then remove performance loss or the smaller stops and slow cycle times, and finally remove your quality loss, or defective products. The result is your overall equipment effectiveness otherwise known as OEE.
Improving OEE with Machine Learning
OEE is an exceptional tool that manufacturers can use to ensure operations are moving smoothly and efficiently during production. Identifying ways to improve OEE can be challenging because the human eye can process limited data at one time. This is where machine learning can be extremely beneficial.
Machine learning technologies possess a unique ability to process high volumes of real-time and historical data extremely fast; providing insights and recommendations in a fraction of the time it would take a human to produce. The time saved can directly impact OEE and give manufacturers an operational advantage over their competitors.
Machine learning applications can also be used to help monitor the production process. If manufacturers can understand past issues in production while being able to address current issues that arise, they will have the tools to make accurate operational decisions. The key is to ensure insights and communications are streamlines from the production line to those in charge of daily operations and vice versa.
Tracking OEE by Equipment
Manufacturing plants have a rare opportunity to utilize different types of technology and equipment, which can create a more granular view of what is needed to streamline operations on a per factory basis.
Tracking OEE by individual pieces of equipment during daily operations can help pinpoint areas of inefficiency on the production line. This will identify any machines that are not properly functioning and potentially contributing to revenue or contribution margin loss. With this information, plant managers or global operations teams can decide if it’s necessary to invest in a newer piece of machinery. Consequently, plant managers or global operations teams will avoid excessive downtime and functionality or revenue loss.
Machine learning can automate and provide these granular-level insights at a much faster rate. IIoT platforms with applied analytics capabilities allow you to filter and visualize your OEE data in different ways to understand the impact of different lines, products, production runs and more.
Comparing Overall Plant OEE
Much like tracking OEE by equipment can inform operational decisions, overall OEE across different lines and factories can allow companies to make more strategic decisions faster. Company-wide OEE tracking helps identify the most efficient factories; including the processes and standards they have in place. These operational standards can be documented and rolled out globally to reduce operating costs and directly impact contribution margins.
Additional benefits include increased production and output by instilling proper protocols and initiatives, reduced variability in global operations and reduced operating costs through more efficient operations.
Tracking OEE on a global scale allows operations and continuous improvement leaders to analyze past and current statistics and maximize productivity in a more consistent and repeatable manner.
Predicting Production Failures in Advance
Wouldn’t it be nice to predict production failures ahead of time? By utilizing and analyzing machine learning from historical data, it becomes easier to predict and prevent when utilization, performance and quality failure may occur. This is done through both condition-based monitoring and setting thresholds for key parameters that indicate potential failures.
For example, if the temperature of a machine increases to a certain level, a predictive alert can be sent to an operator or engineer on the factory floor. This allows them to proactively review and address the situation before it becomes unplanned downtime.
Standardizing Quality Metrics for OEE Calculation
Quality failures also can be predicted similarly. To do so, there are two types of data that need to be analyzed. Inline data is gathered by inspecting products on the production line while offline data is gathered by inspecting products when they are removed from the production line.
If we know that a drop in inline speed typically causes quality failures, a real-time alert can be generated anytime the line speed drops to a certain level. Therefore, factory personnel can take immediate action and limit the amount of defective product.
Additionally, machine learning applications can also help manufacturers overcome data accuracy issues when it comes to calculating quality metrics for OEE. After analyzing approximately three to six months of inline and offline quality data, machine learning technologies can build predictive models to estimate scrap rates and quality failures. These models can then be used to continually estimate scrap rates and improve the accuracy of OEE calculations.
Tracking OEE Calculations With Industrial IoT Platforms
An advanced analytics solution can help you track key manufacturing performance metrics. Interactive dashboards help visualize the data across a variety of views and allow you to drill down the root cause of utilization, performance, and quality failures.
In addition, these platforms can use both predictive and prescriptive analytics to provide automated insights and actionable alerts which help operators, process engineers, and QA engineers:
- Take the necessary actions before the failures begin
- Reduce scrap rates and unplanned downtime
- Improve overall performance across the factory floor

Start Calculating OEE More Efficiently Today
Automating OEE tracking and analysis can help improve your daily operations as well as eliminate frustrating errors that have occurred in past production cycles.
Learn more about using machine learning to calculate OEE as well as predict and prevent production failures.

